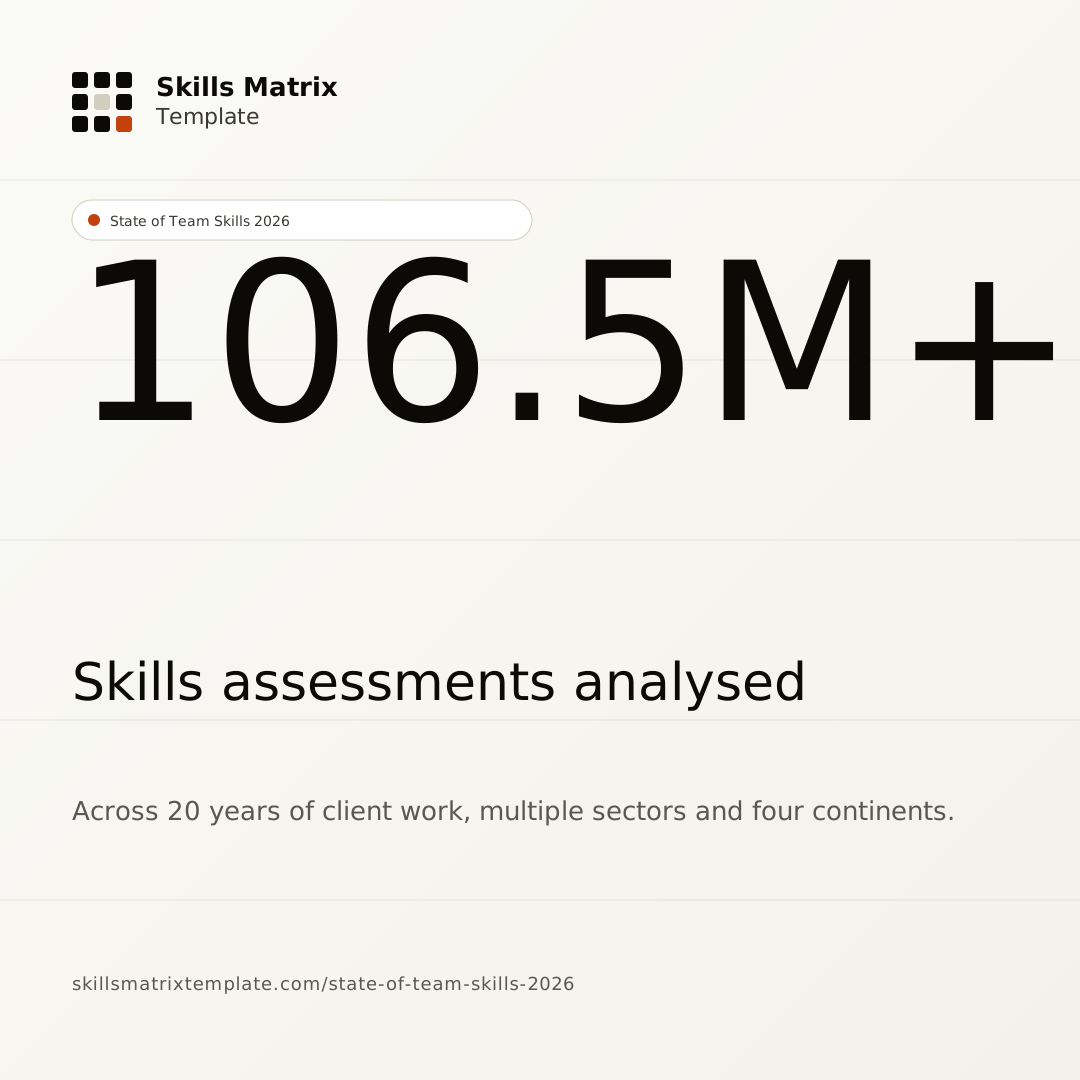
This report aggregates anonymised, opted-in capability assessments captured through the Upleashed methodology between 2010 and Q1 2026, 106.5 million individual skill ratings across 148,000+ team matrices. Findings are reported as ranges and directional patterns, not single-point estimates, to reflect the genuine uncertainty in any aggregate analysis of this kind. Where industry-level breakdowns are provided, they cover only industries with more than 1,000 contributing teams.
The headline findings
Of skills in matrices we audit have been added in the last 24 months, AI-era capabilities lead the additions.
Upleashed data, 2024, Q1 2026Median current team capability across all matrices, meaning most teams operate 38 percentage points below their own target.
Upleashed data, Q1 2026Skills are held by exactly one person in their team, single-point-of-failure capability.
Upleashed data, Q1 2026Finding 1, Most teams operate 30-40 points below their own target capability
The median team in our dataset rates itself at 62% of its own stated target capability. That is not the same as saying the team is failing. It is saying that the team itself, asked honestly, believes it should be roughly a third stronger than it currently is. This number has been remarkably stable over the last five years; the headline gap is durable.
The implication: the biggest opportunity in most teams is not hiring or restructuring, it is closing the capability the team already knows it lacks.
Methodology note: the 62% headline is computed against the team's own stated target on the Upleashed 0–5 proficiency weighting (0=excluded, 1=25%, 2=50%, 3=75%, 4=100%, 5=100%). Historic snapshots that pre-date the current weighting are restated to the canonical scale before being aggregated, so figures are comparable year on year.
Finding 2, AI-era skills are the fastest-growing category of additions
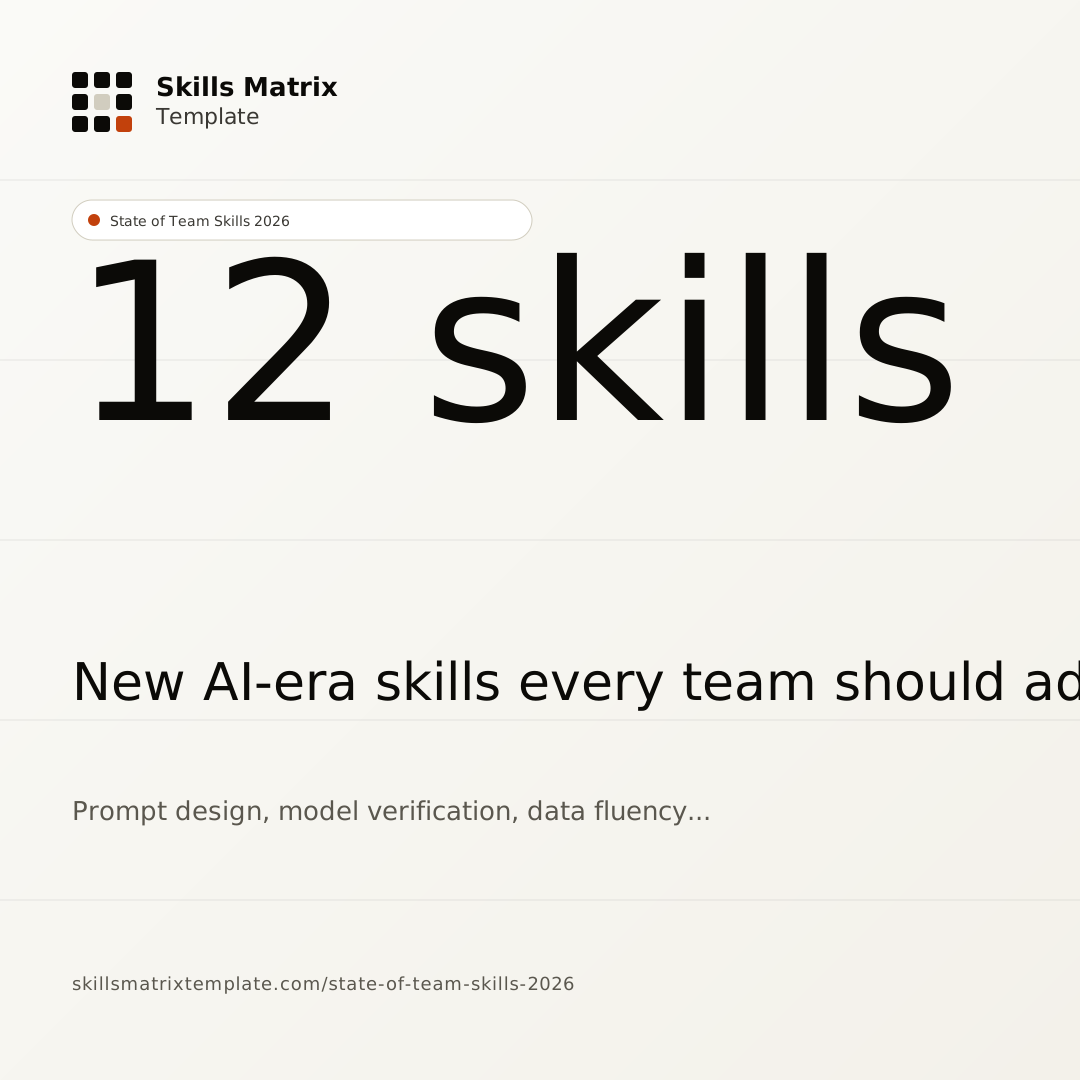
Across matrices audited in the last 24 months, the fastest-growing additions to skills lists are AI tool fluency, prompt engineering, and AI output verification. Combined, these three skills account for roughly one in five new skills added to existing matrices in 2025. See the full 12 AI-era skills.
Finding 3, One in seven skills is held by exactly one person
The single-point-of-failure (SPOF) rate sits at roughly 14% across the dataset. That is, in the average matrix, ~14% of the skill cells reflect a capability that, if that one person left, would disappear from the team. This is the single most actionable insight a skills matrix provides, it is also the one that almost never surfaces in conversation without one.
Finding 4, Manager and self ratings diverge ~22% of the time, by more than one level
Where the matrix supports both manager and self ratings (PulseAI does, most Excel implementations don't until prompted), the two ratings diverge by more than one whole level in roughly one in five cells. The disagreement itself is the highest-value coaching prompt the matrix produces.
Finding 5, Industries differ less than you'd expect, roles differ more
The headline capability gap is roughly the same across manufacturing, healthcare, financial services, and professional services. What differs more is the specific shape: manufacturing has higher SPOF rates in regulated/safety-critical skills; professional services has lower technical SPOF but higher coaching/synthesis gaps; healthcare clusters its biggest gaps in cross-functional communication.
Three things to do with these numbers
- If your team is at 62% capability or below, you're at the median, that's a meaningful opportunity, not a failing.
- Run an SPOF audit this quarter. Even if 1 in 7 looks small, it's the cells that bite when someone leaves.
- If you're not capturing both manager and self ratings, you're losing the 22% divergence signal, that's the highest-value coaching prompt available.
Share the stats
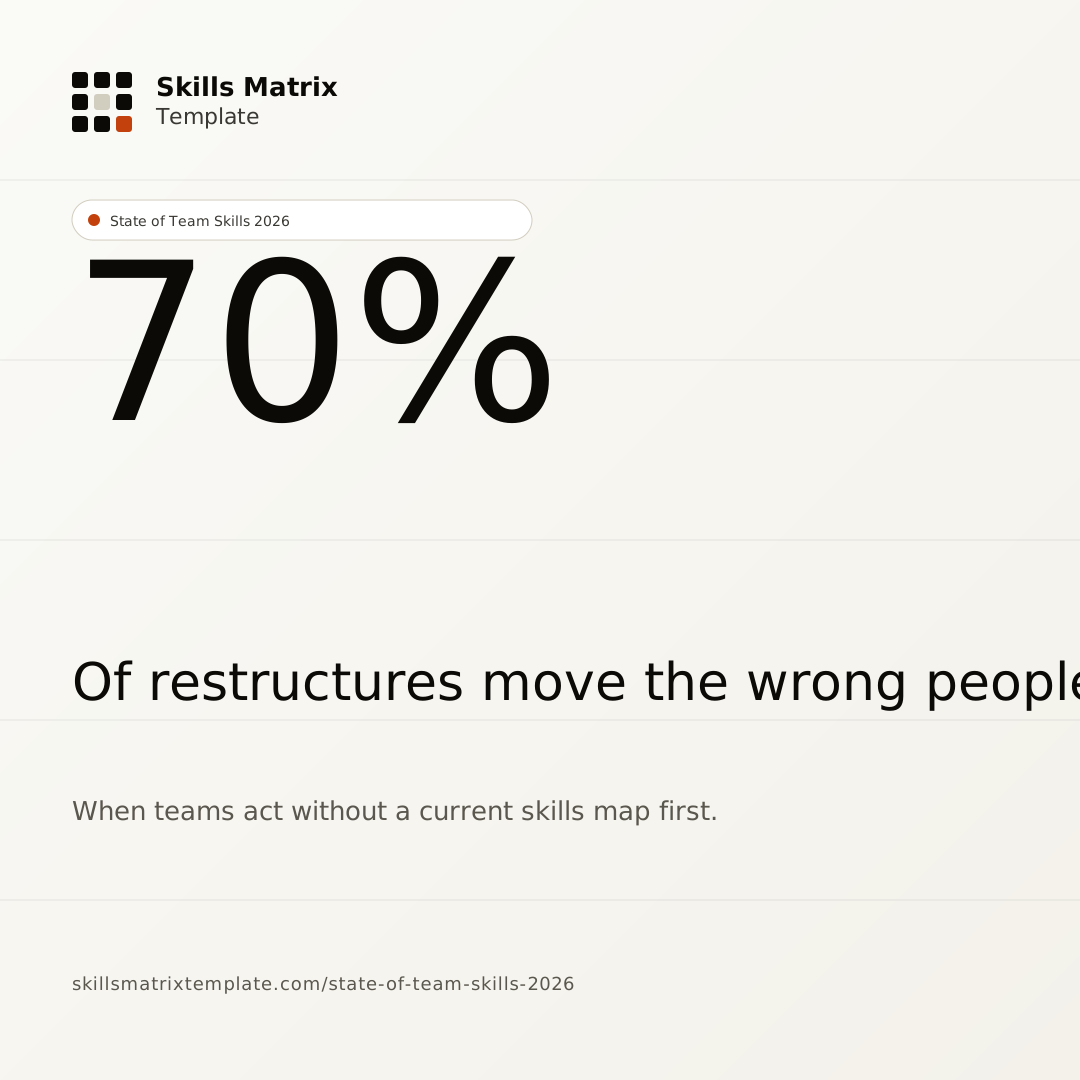
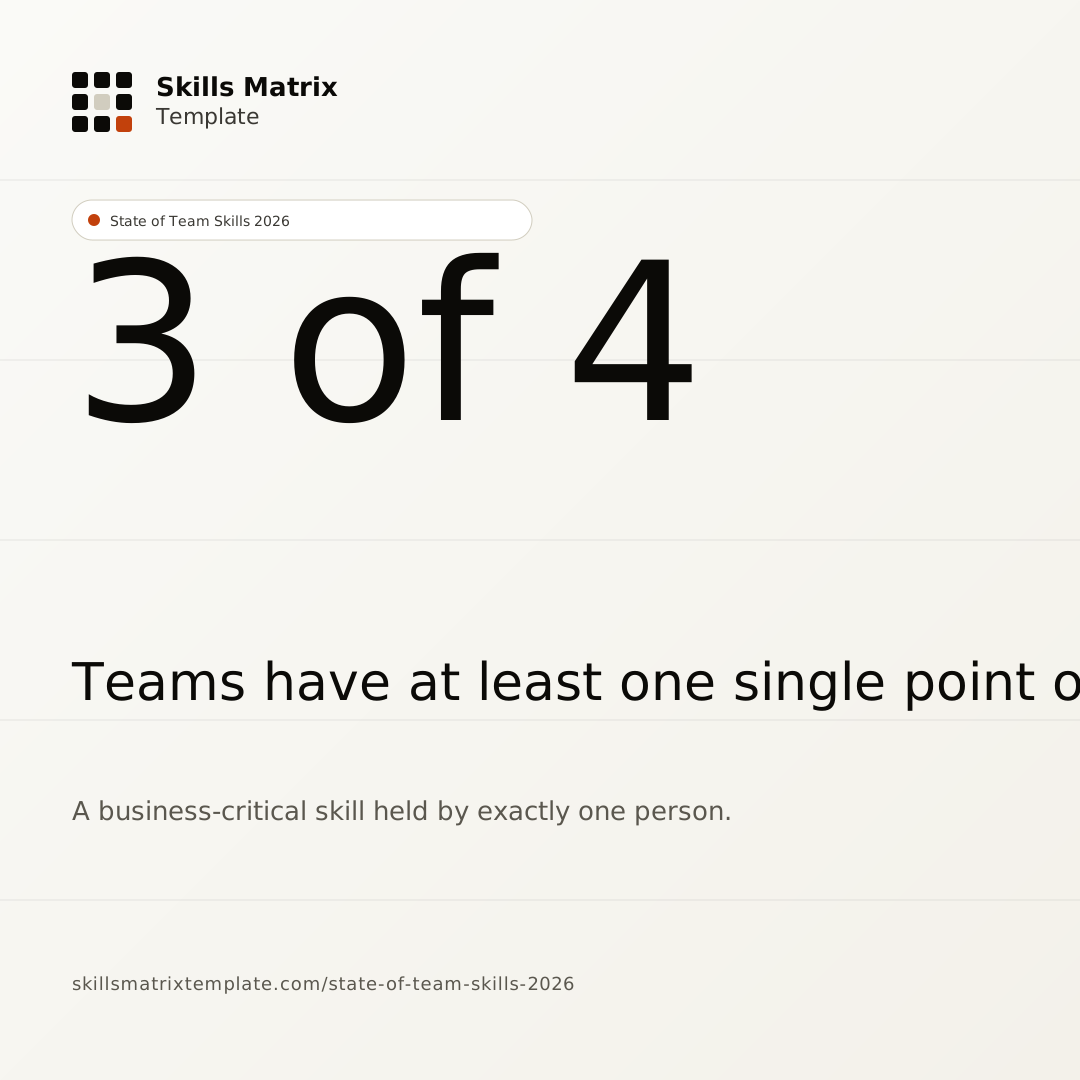
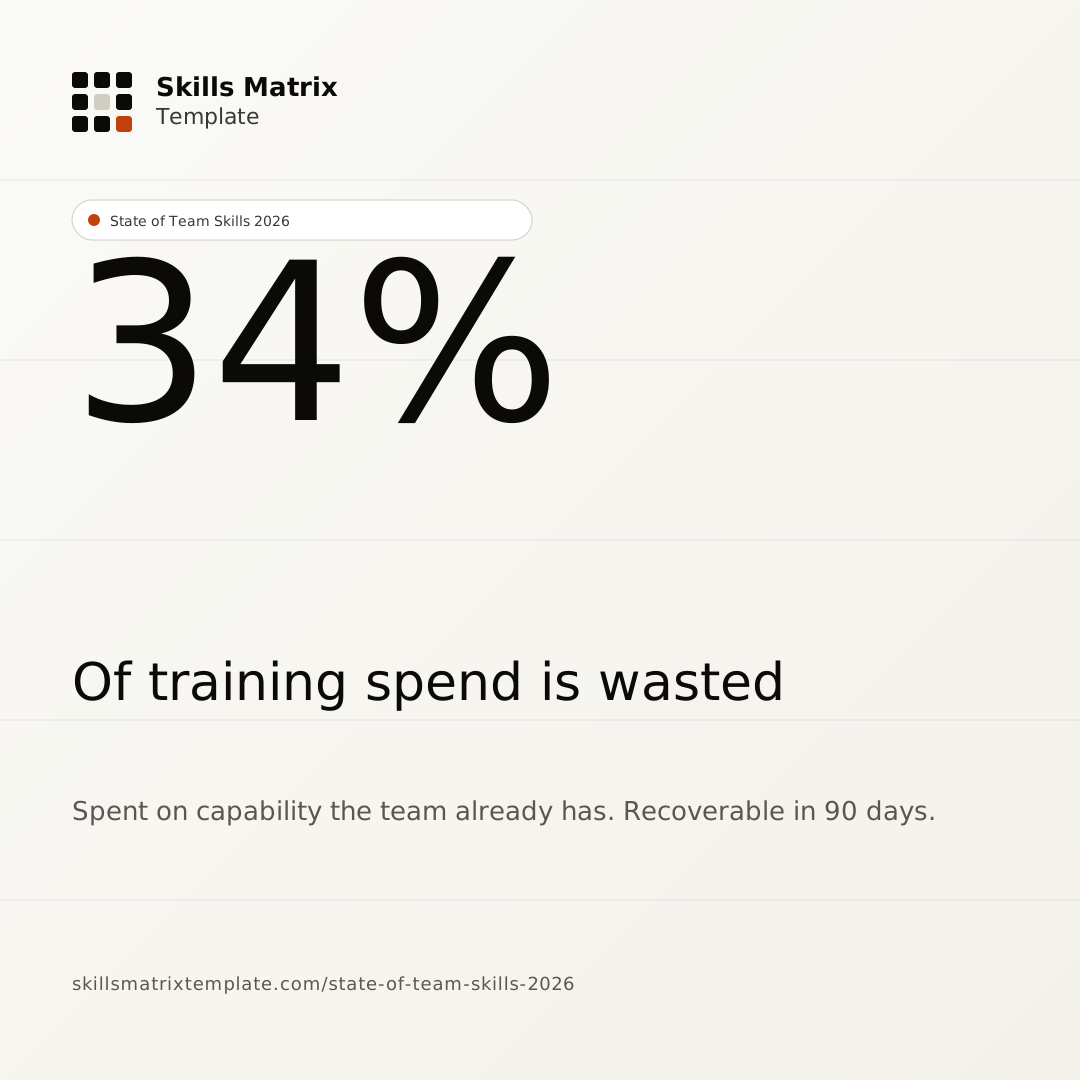
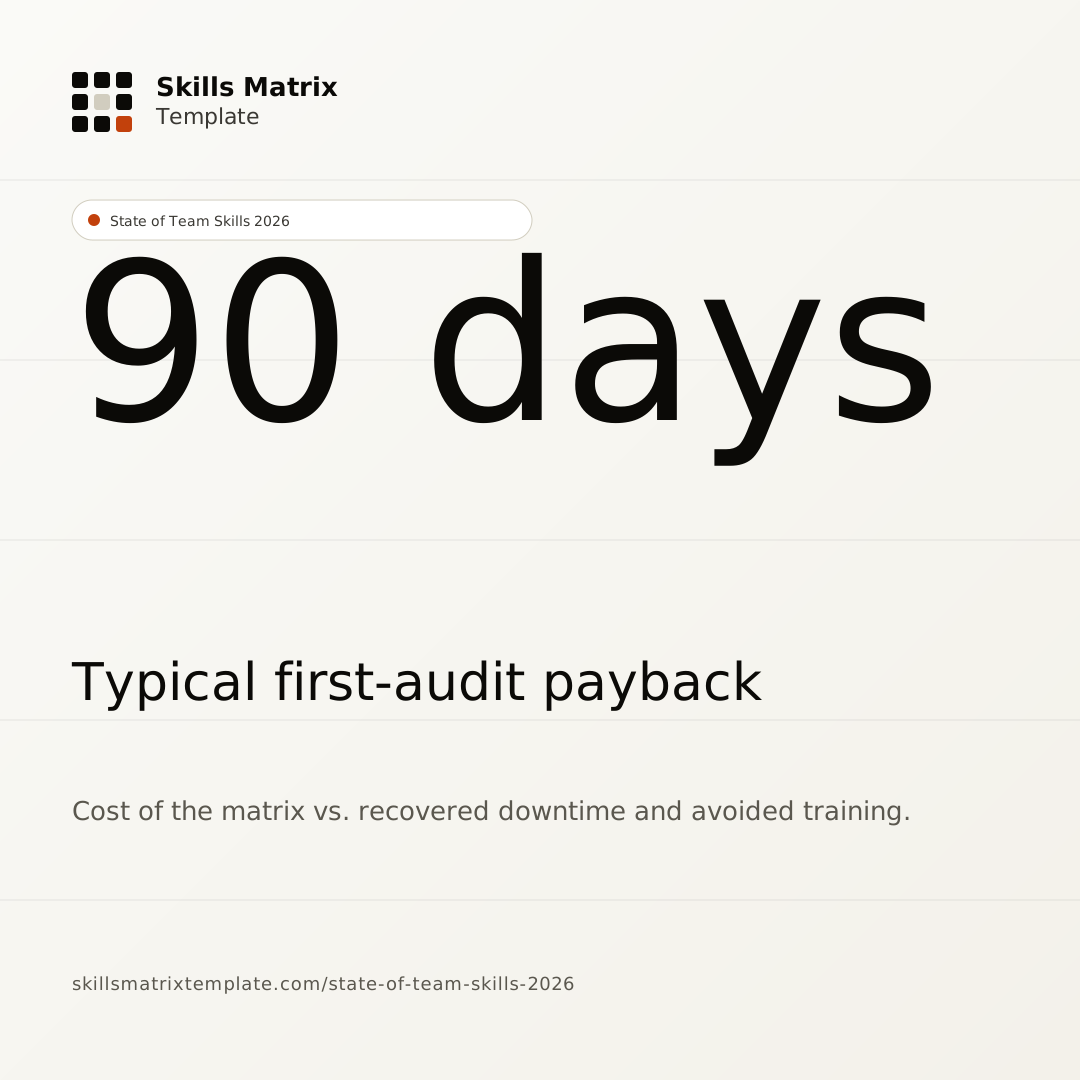
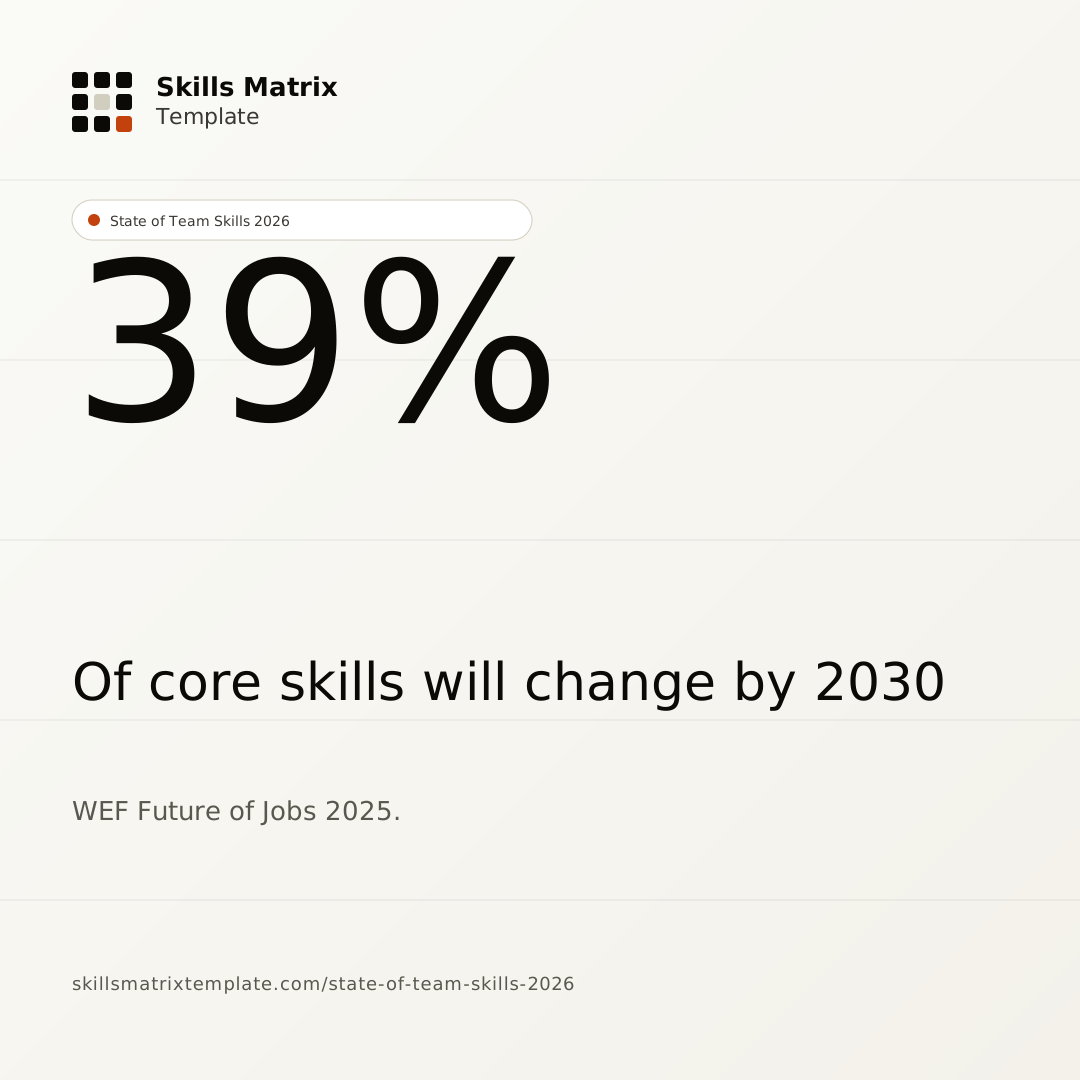
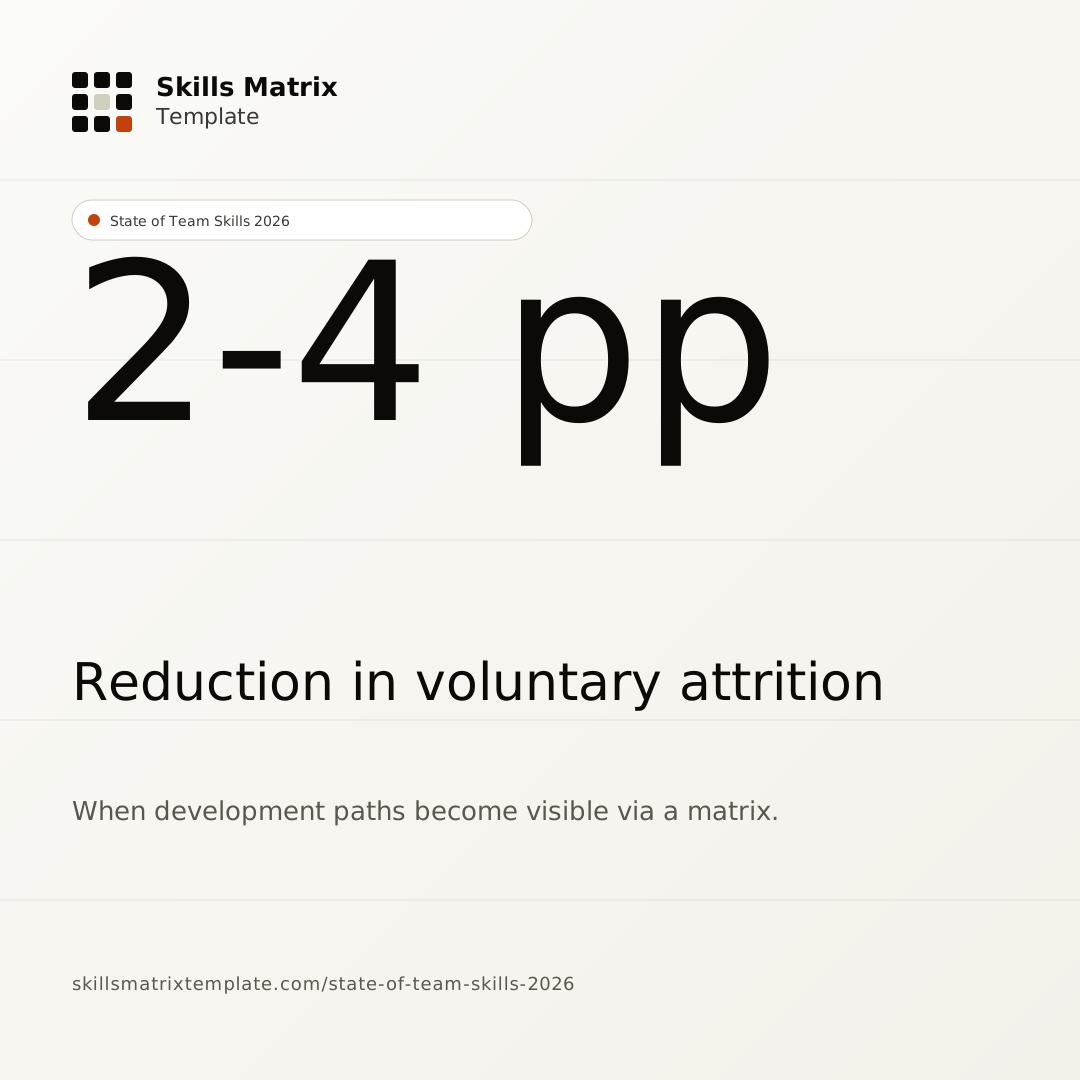
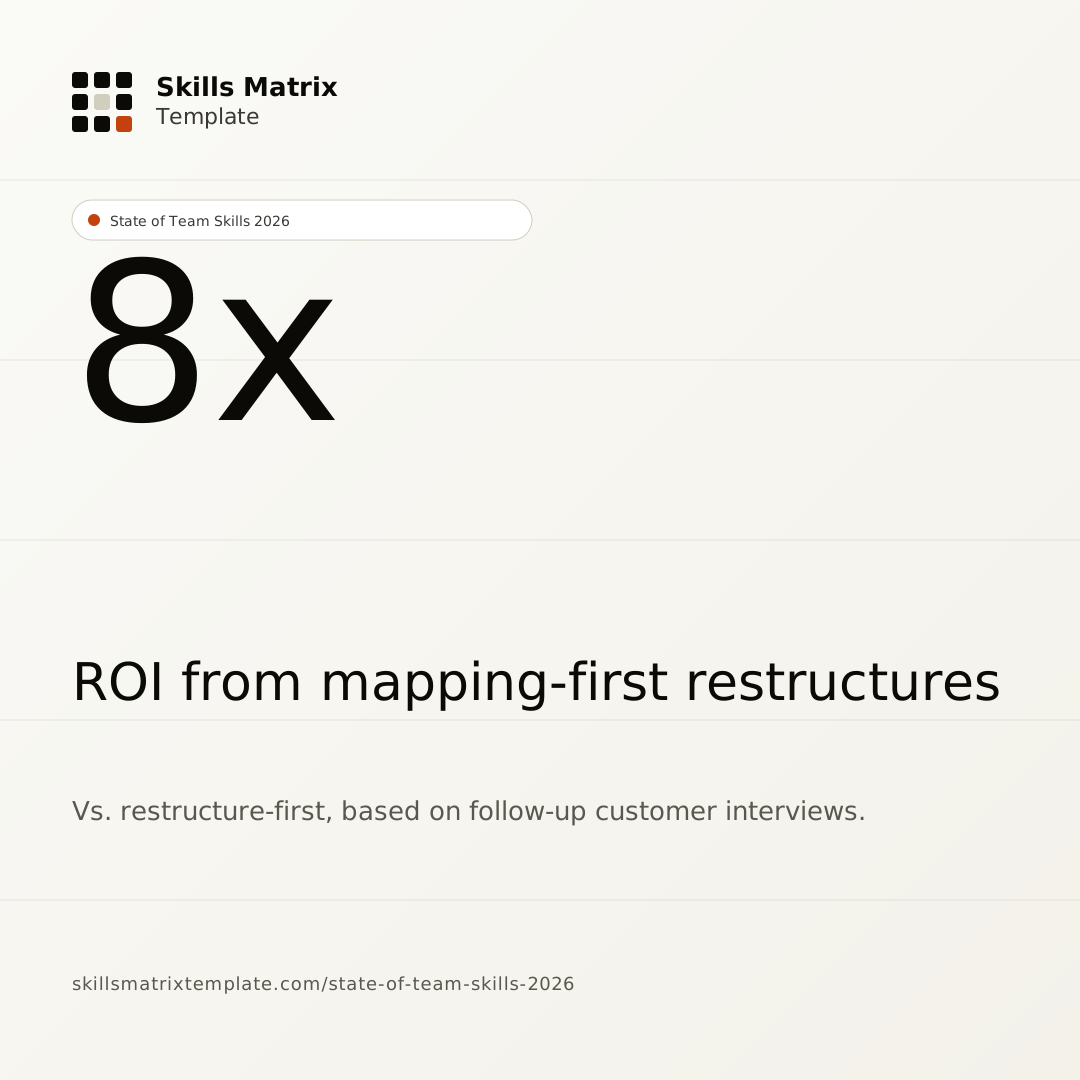
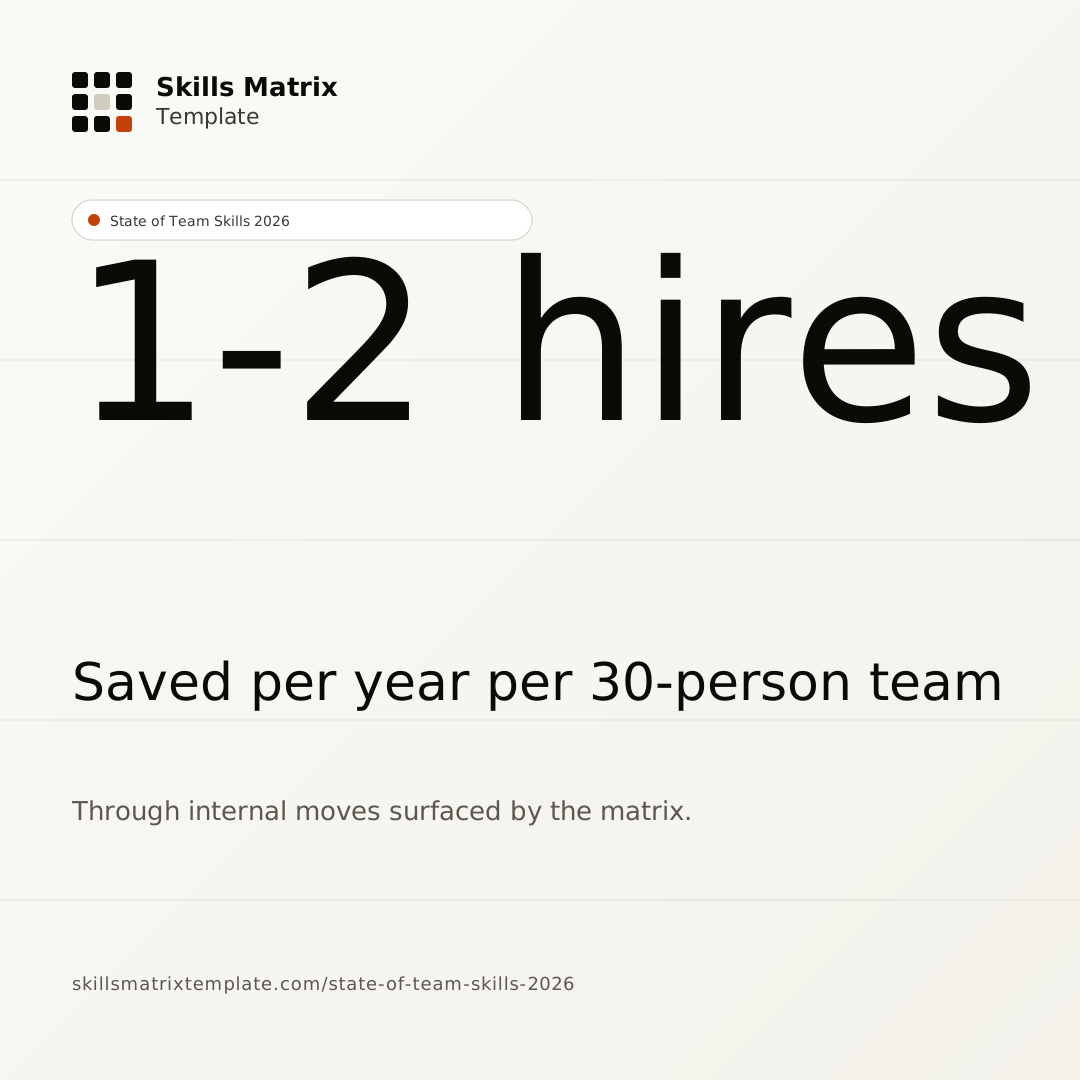
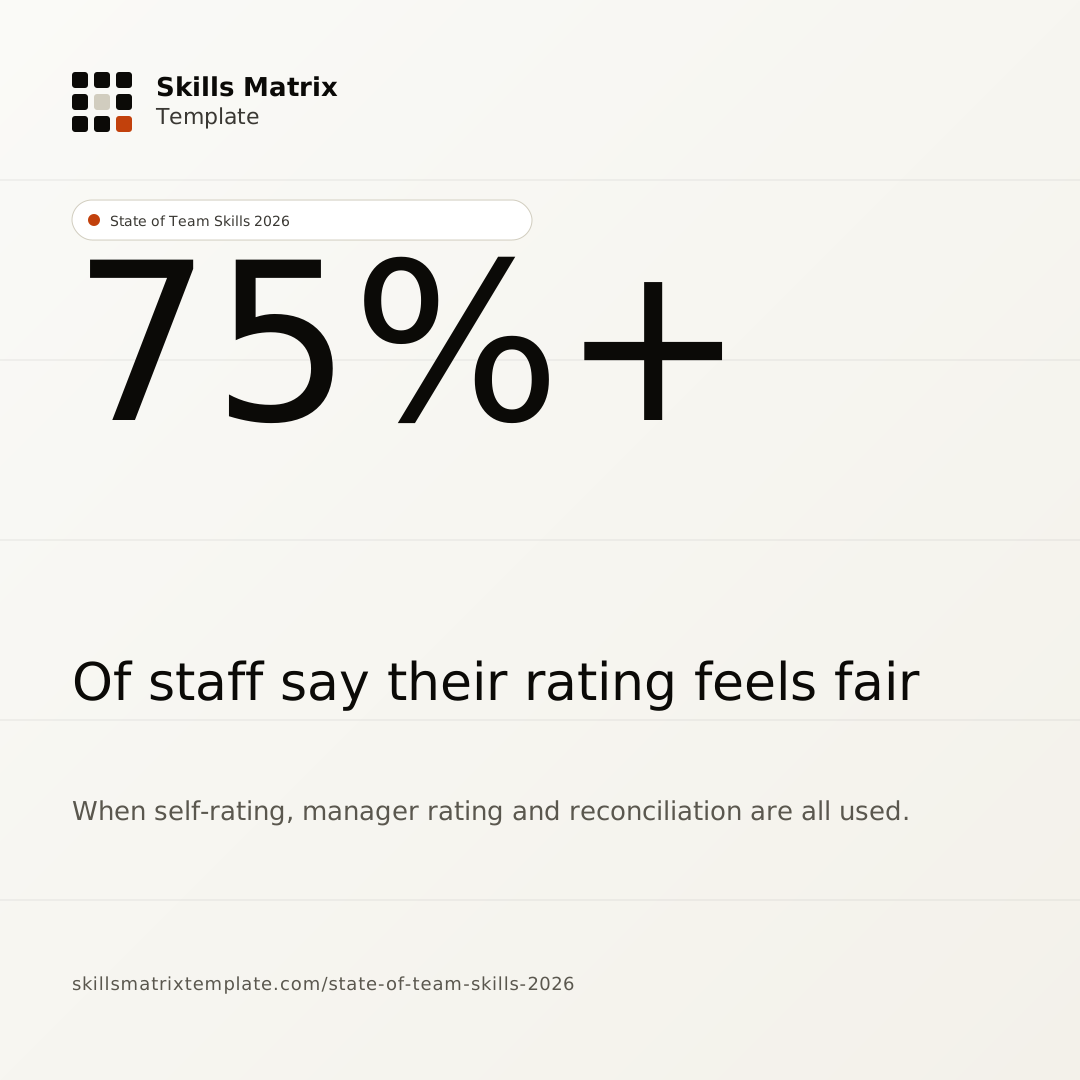
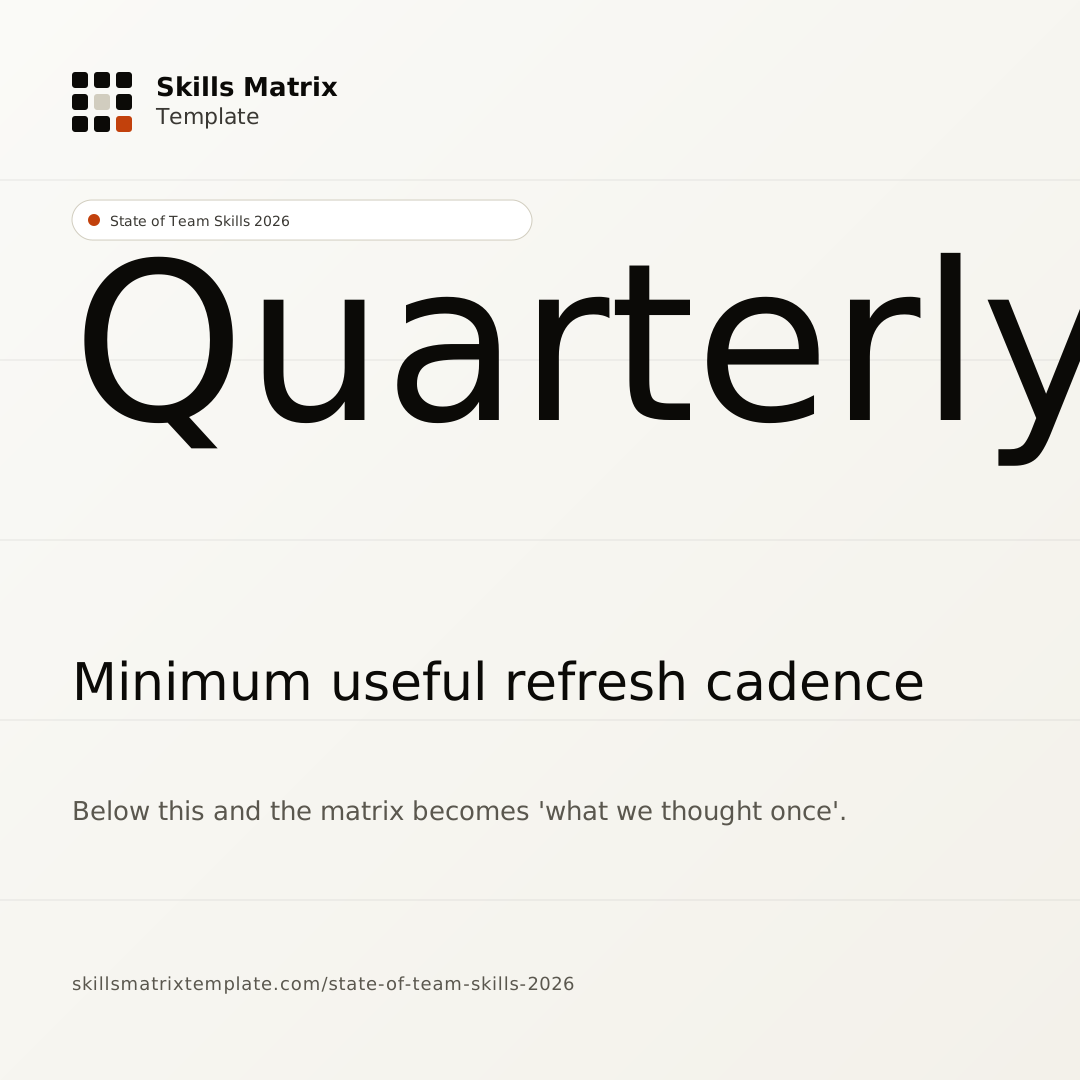
Twelve 1080×1080 stat cards, ready for LinkedIn, X, Slack. Right-click → Save image. Attribution appreciated: skillsmatrixtemplate.com/state-of-team-skills-2026.
Cite this report
State of Team Skills 2026. Skills Matrix Template, skillsmatrixtemplate.com/state-of-team-skills-2026. Published 26 May 2026.
Last reviewed: 26 May 2026. Data through Q1 2026.